Sample report · simulated data, fictional building.
Station log
Every station, every week.
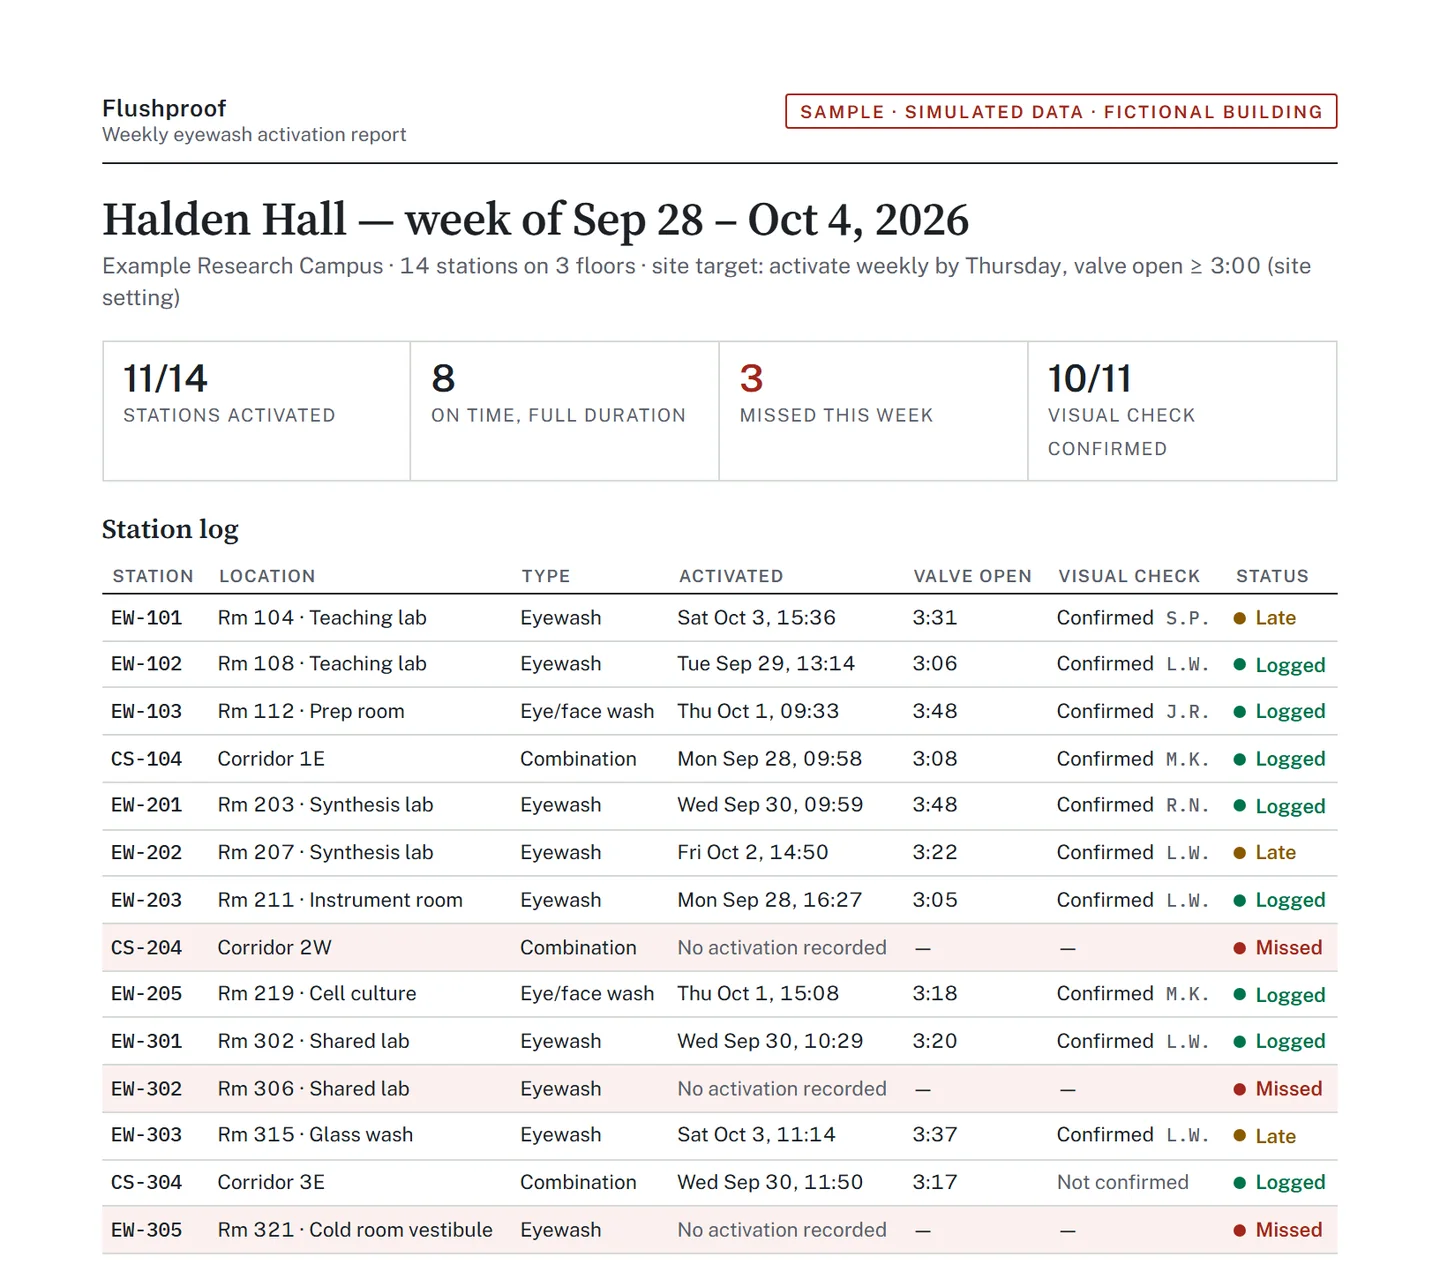
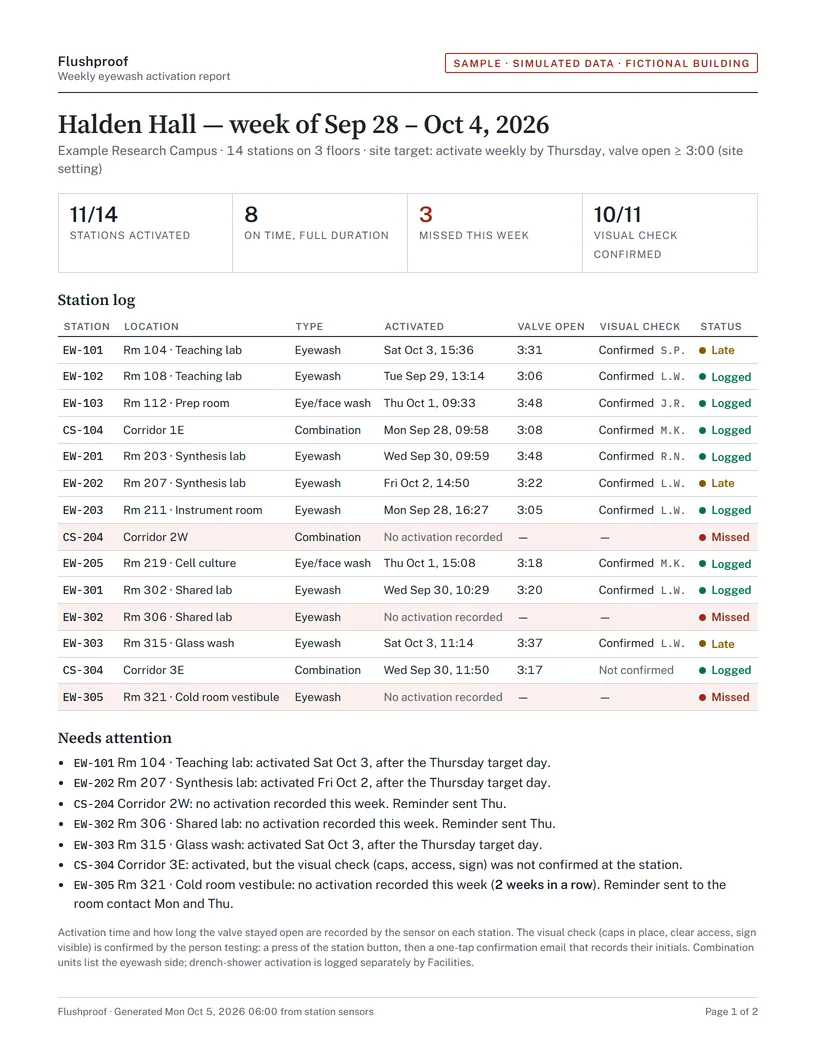
Each row is one eyewash: when it was activated and how long the valve stayed open, to the second. Both come from the node, not from someone’s memory at the end of the week.
In the sample: 14 stations, 11 activated, and a site target of the valve open for at least 3:00.
Sample report · simulated data, fictional building.
Visual check
Who confirmed the visual check.
The node can’t see whether water reached both heads, the caps are on, the path is clear and the sign is visible. A person can. The person testing presses the station button; the confirmation email goes to the lab’s room contacts, and whoever taps it is recorded by initials, the way the paper log does. The record shows who confirmed, not who stood at the station.
In the sample, CS-304 was activated but nobody confirmed the check, so the report says “Not confirmed” and lists it under Needs attention.
Sample report · simulated data, fictional building.
Needs attention
Missed stations are flagged the same week.
A station with no activation shows up in red, by station and room. If it still hasn’t been activated by Thursday, the room contact gets a reminder email; a station that also missed the week before gets a Monday reminder too. The report notes when each was sent.
In the sample, EW-305 in the cold-room vestibule has missed two weeks in a row.
Sample report · simulated data, fictional building.
History and records
Thirteen weeks on one page, ready to print.
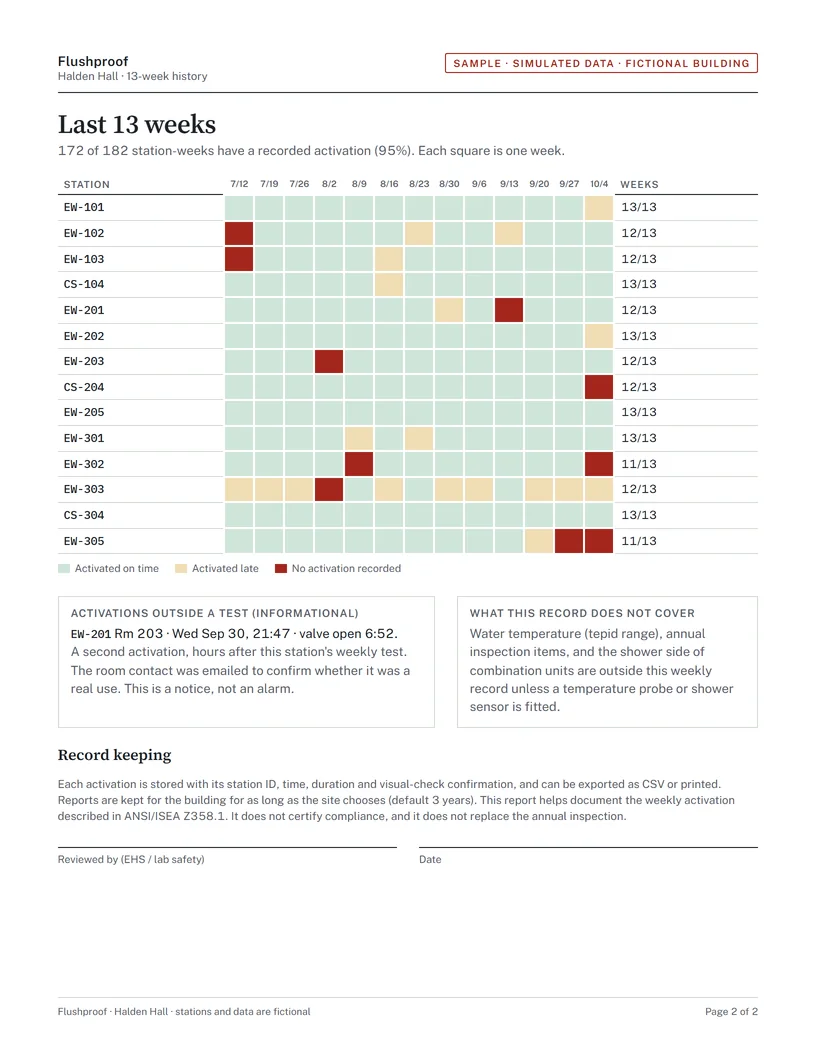
Page 2 shows the last quarter, one square per station per week: 172 of 182 station-weeks have a recorded activation. Every activation is kept with its station, time, duration and confirmation, exports as CSV, and prints on demand.
Records are kept as long as the site chooses; the default is 3 years.
Download the sample report (PDF)